
Health and household Amazon PPC case study: monthly sales up 82% to $59K
An Amazon PPC program for a health and household brand that grew monthly sales from $32K to $59K between May and October 2023, while bringing ACOS down from 43.18% to 36.35%.
A health and household brand scaling sales on Amazon.
This brand sells health and household products on Amazon, a category where shoppers compare many similar options. The goal was to grow monthly sales and bring advertising efficiency down at the same time.
Our team built structured PPC campaigns around the brand’s best-performing products and search terms, then scaled the campaigns that converted.
The challenge
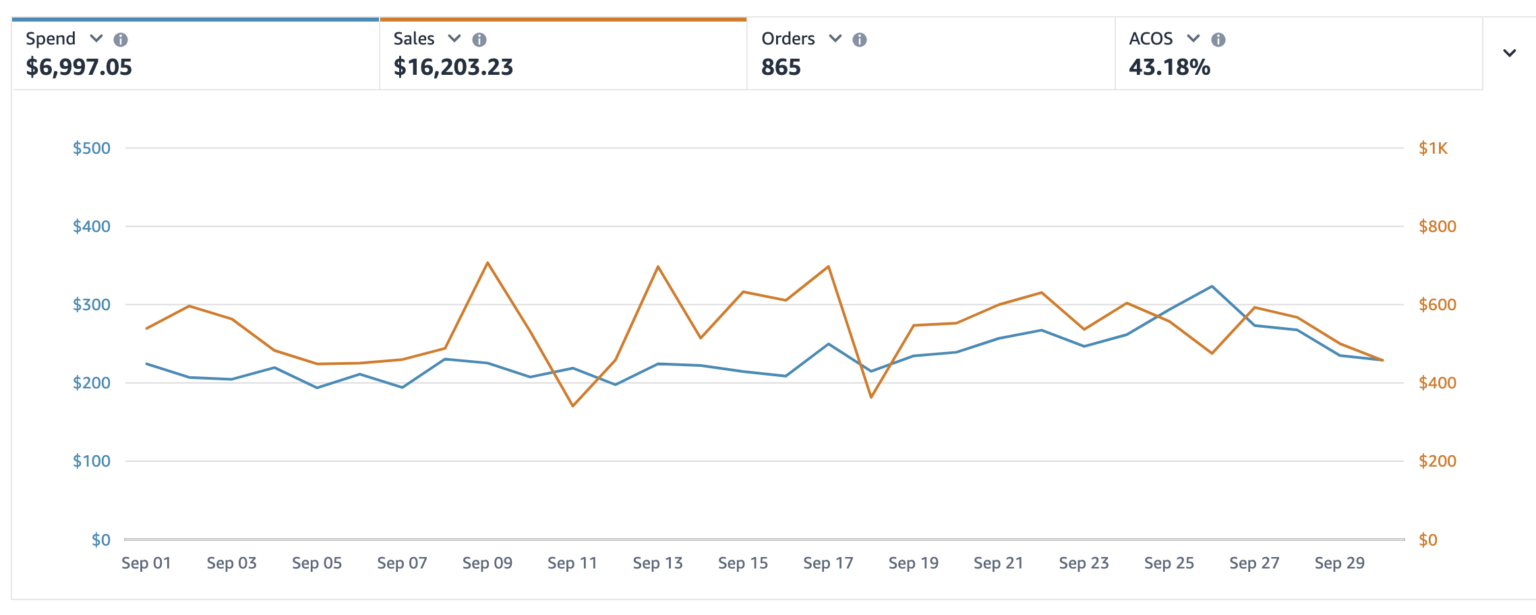
ACOS in September was 43.18%, which left little room to scale profitably. The goal was to grow sales while bringing ACOS down, not simply to spend more.
Campaigns were organized so budget followed the terms and products that performed.
Account snapshot
Real console data, order growth figures.
Screenshots taken directly from the brand’s Amazon Ads console and Seller Central. Click any image to view full size.
A structured, data driven Amazon PPC approach.
Four moves, run together, to grow sales while bringing ACOS down.
Keyword research and campaign structure
Campaigns were organized around the brand’s highest-intent health and household search terms, with proven keywords separated from discovery so budget followed performance.
Search term pruning
Search terms were reviewed regularly, with negatives added for queries that did not convert and converting terms moved into focused campaigns.
Bid and placement management
Bids and placements were adjusted as data arrived, shifting budget toward the terms and placements that produced sales.
Efficiency over volume
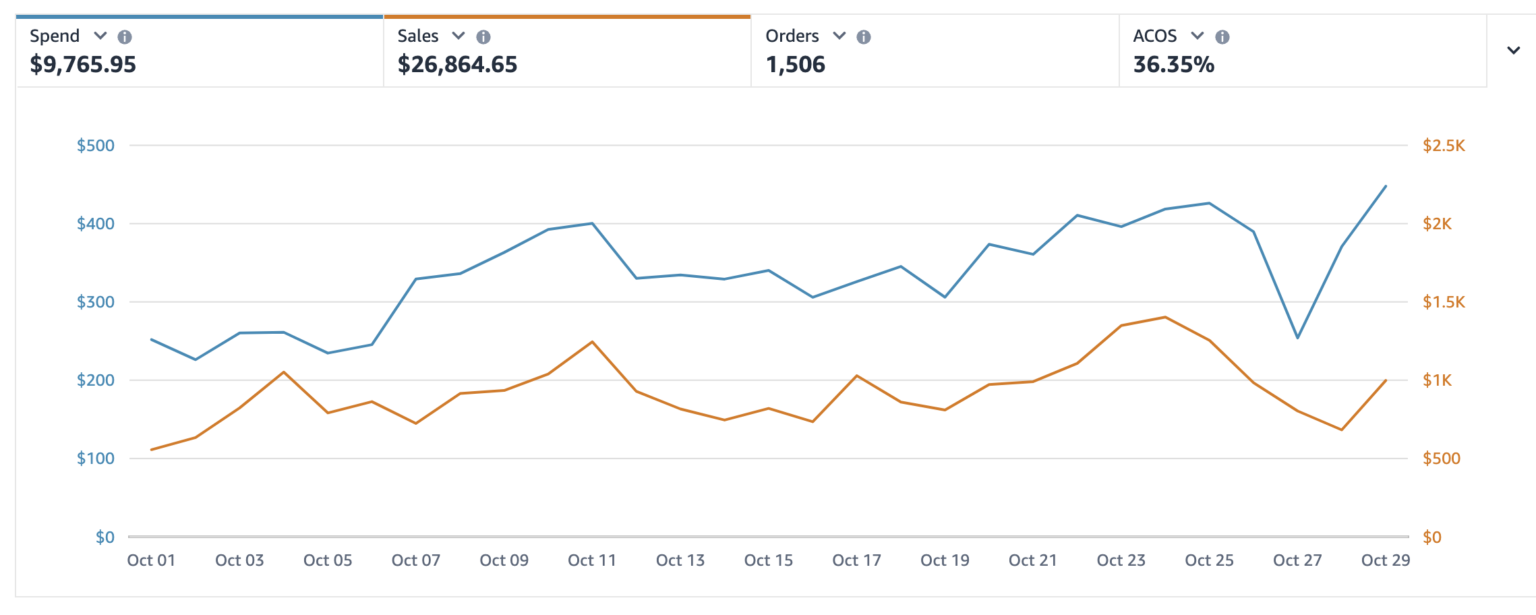
From September to October, spend rose 40% while ad sales rose 66% and ACOS fell by about 7 percentage points.
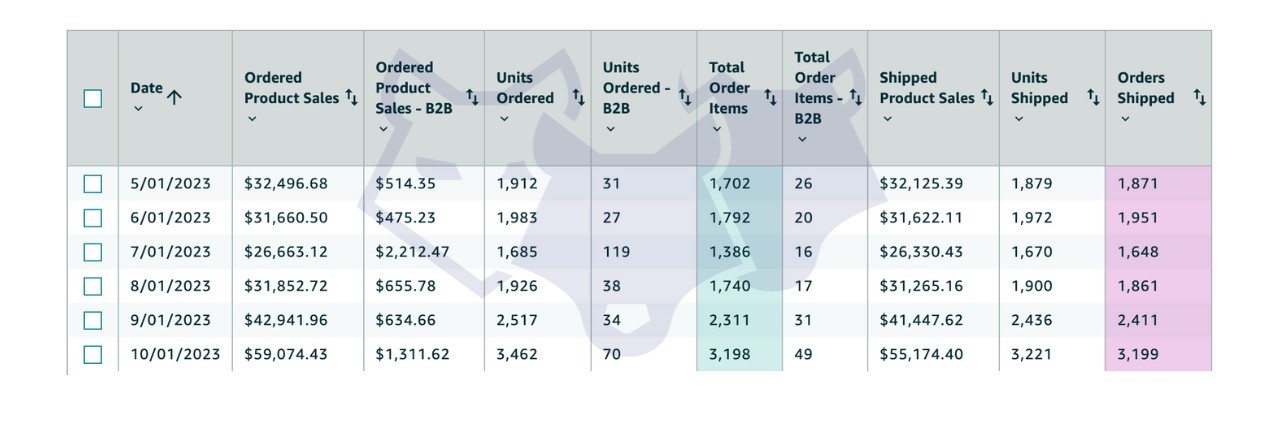
82% monthly sales growth from May to October, reaching $59K in a month.
From September to October, ad sales grew 66% on 40% more spend, orders rose from 865 to 1,506, and ACOS fell from 43.18% to 36.35%.
Monthly ordered product sales trajectory
Overall business sales grew from $32,496.68 in May to $59,074.43 in October, with a dip in July before the strongest months of the period.
Source: Amazon Seller Central Business Reports, 2023. Bar heights scaled relative to the October peak ($59,074.43).
| Performance metric | Result | Source |
|---|---|---|
| Monthly ordered product sales | $32,496.68 (May) to $59,074.43 (Oct), +82% | Seller Central |
| Monthly units ordered | 1,912 to 3,462 (+81%) | Seller Central |
| Ad sales | $16,203.23 (Sep) to $26,864.65 (Oct), +66% | Amazon Ads console |
| Ad spend | $6,997.05 (Sep) to $9,765.95 (Oct), +40% | Amazon Ads console |
| ACOS | 43.18% (Sep) to 36.35% (Oct) | Amazon Ads console |
| Orders | 865 (Sep) to 1,506 (Oct), +74% | Amazon Ads console |
“Efficiency comes before volume: in this account, ad sales grew faster than spend while ACOS came down.”
Growth Architech · Amazon PPC teamWant results like this on Amazon?
Get a free audit of your Amazon Ads account and see exactly where your budget is leaking before you spend another dollar. Selling health or household products? Read about our Amazon PPC for health and household brands.