
E-commerce Google Ads Scaling: Boosting ROAS to 10.79x and Increasing Revenue by 74%
Overhauling a restricted Google Ads account through automated asset groups, feed optimization, and multi-layered campaign architecture to capture high-intent buyers.
Background Information of Growing E-commerce Retail Brand
This rapidly growing e-commerce brand operates in a highly visual consumer goods vertical. They offer high-demand products directly to consumers. We mapped their entire scaling journey inside our Google Ads e-commerce portfolio. Relying on digital storefront conversions, the brand requires a high-volume customer acquisition engine. To maximize profitability, they transitioned away from basic text ads. Consequently, they fully tapped into asset-rich, automated Google Shopping networks to capture strong purchasing intent.
Problem
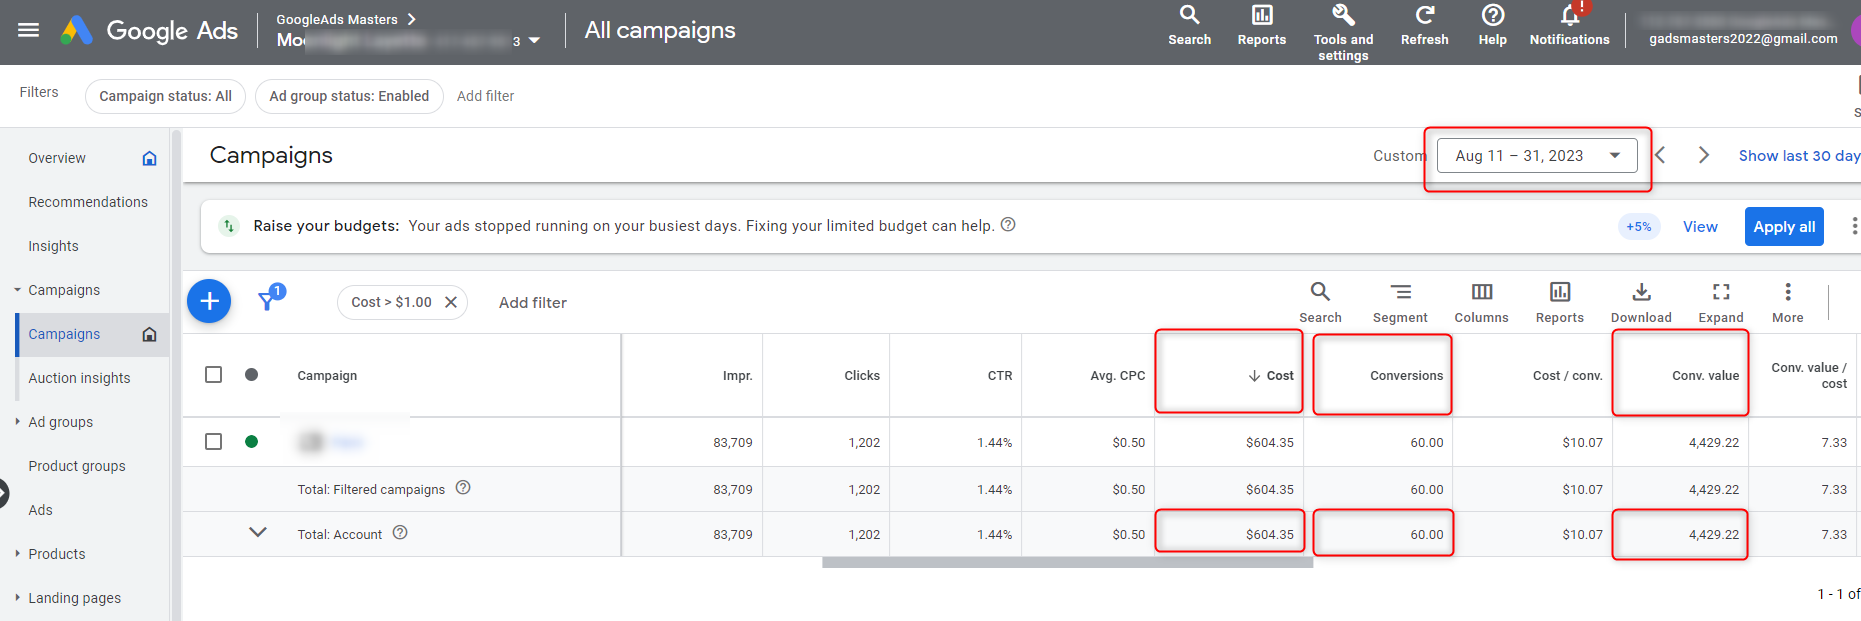
Scaling an e-commerce brand on Google Ads presents intense challenges. These include aggressive competitor price wars and rising click costs. Furthermore, brands face strict return on ad spend requirements to preserve product margins. As shown, the brand's metrics between August 11 and August 31 revealed a plateau in efficiency. The account generated $4,429.22 in conversion value from an ad spend of $604.35.
A 7.33x ROAS was stable, but the account suffered from structural bottlenecks. Specifically, it relied on a single unoptimized campaign template. This triggered a warning to raise budgets because ads stopped running on busy days. Because the structure could not scale efficiently, the brand missed high-intent conversion windows. Consequently, total monthly sales capped at 60.00 conversions with an average cost of $10.07.
Baseline Period (Aug 11 – 31, 2023)
Side by side, straight from Google Ads
Comparing the baseline performance against our optimized campaign architecture.
Solution
To eliminate budget restrictions and unlock high volume revenue, we overhauled the account by deploying a multi layered campaign architecture focused on product level bidding efficiency and asset optimization.
-
Performance Max & Feed Optimization
We restructured the account by launching high performing Performance Max campaigns alongside focused Search components. We cleaned the Google Merchant Center product feed by rewriting product titles with rich SEO keywords and optimized high definition custom images to radically improve ad relevance scores.
-
Asset Group Audience Signals
We built distinct asset groups tailored specifically to different audience signals, utilizing custom intent segments, past purchasers, and lookalike lists. We supplied Google's machine learning with premium lifestyle images, promotional text, and clean product assets to dominate placements across YouTube, Display, and Shopping.
-
Data-Driven Budget Allocation
We solved the "limited by budget" bottleneck by shifting from single campaign reliance to an optimized, multi campaign structure. This allowed us to split out top selling "hero" products from lower performing SKUs and move to a target ROAS (tROAS) bidding model prioritizing high value checkouts.
-
First-Party Data Integration
We verified that enhanced conversion tracking was collecting precise transaction values through the website's shopping cart. By feeding clean, real time purchase value data directly back into the Google Ads tag, the machine learning system was able to efficiently prioritize high order values over low margin sales.
Results: Unprecedented Profitability in 21 Days
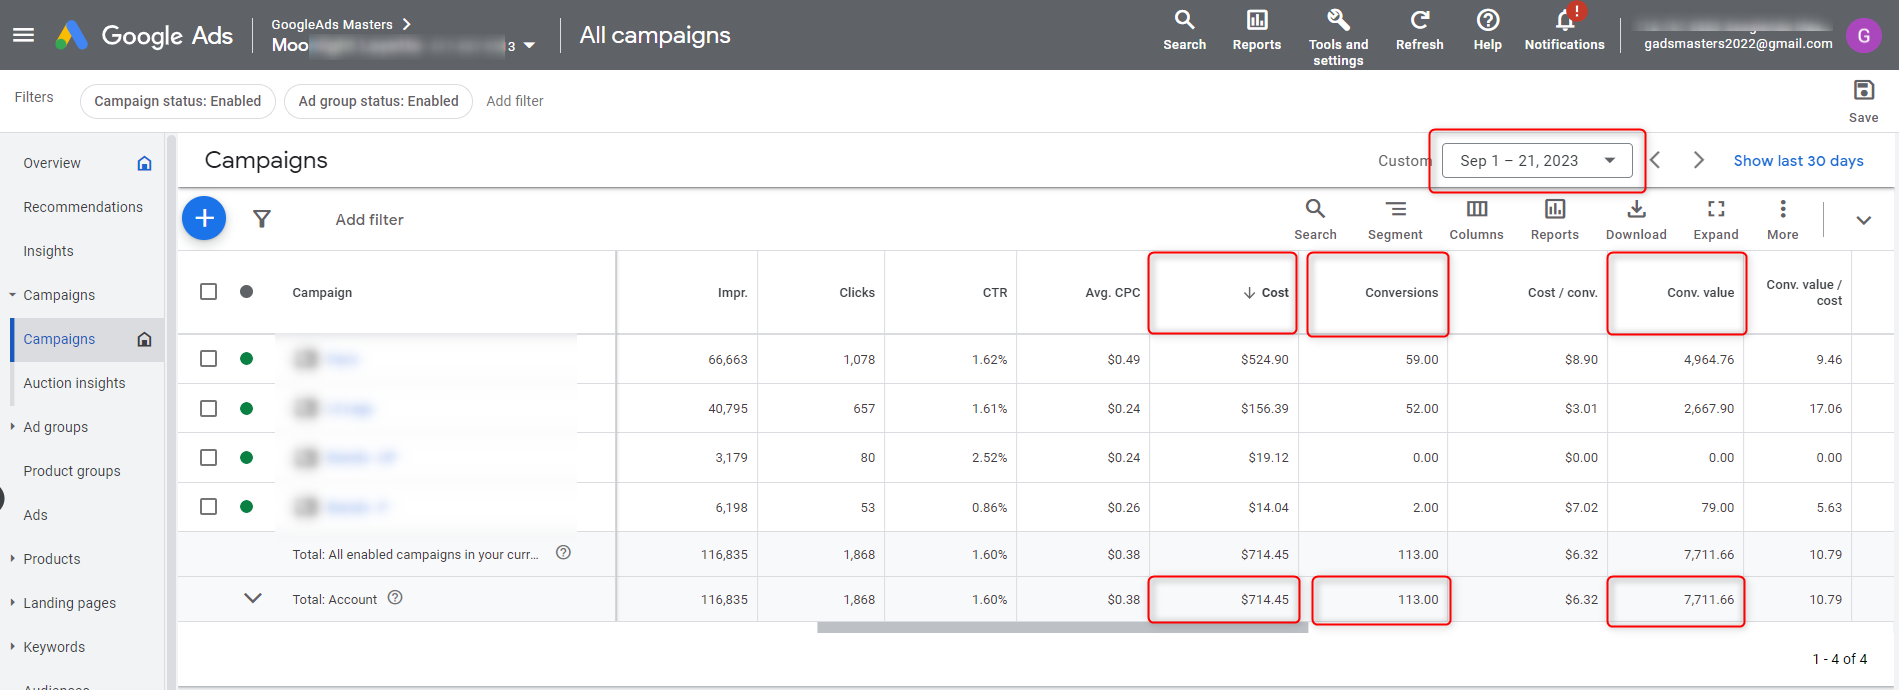
Our strategic restructure and transition to automated asset groups unlocked explosive scaling and unprecedented profitability. As detailed by comparing both images (from September 1 to September 21, 2023):
Live Google Ads campaign report, Sep 1 to 21, 2023.
"By eliminating budget bottlenecks and maximizing Google's automated shopping networks, we turned a restricted e-commerce account into a highly automated, hyper profitable scaling engine."
Growth Architech · E-commerce Growth TeamReady to scale your e-commerce revenue?
Get a free audit of your Google Ads account and see how we can optimize your product feed, bidding structure, and campaign efficiency.